P-harp

Challenge to the forthcoming ultra-healthy society

モーダルクローズボタン

Japan
Medical
Bills

Japan Medical Bills are increasing over 43 trillion JPY

Cure or treatment after illness needs big burden in physical, mental and economical. AXR is realizing the bright social life for all by increasing the immunity against illness and decreasing/removing stress for health recovery.

National medical expenses in Japan

1995 27.0 trillion JPY
2020 43.0 trillion JPY
2021 44.2 trillion JPY
2022 44.2 trillion JPY

In 2020, 2021 and 2022, Japanese government approved the additional budget for COVID-19 countermeasures independently and quickly. In 2022 it was $ 8.387 billion at the exchange rate: 143.95JPY/USD @June 26, 2023 … however, its 90% is untraceable, according to Nikkei Inc. Web because of the low transparency. It’s supposed to increase the medical expenses of the Japanese society and the individual burden. We should be reducing it even if only slight by managing our healthiness and QoL for the future.

Source: Overview of national medical expenses in Japan

モーダルクローズボタン

Analyze
Health
Data

Health maintenance system is perfectly controlled by 234 type cells in body. Cellular metabolism and reactive oxygen/ROS influence it in serious consequences by mitochondria. With the best control, you can reduce the disease risk and realize “Healthy Body with QoL” by AxHELP!

Information of blood data or vital one to use for “AxHELP” looks like the report card about the body network and it can be usually used for the early detection of diseases. Those are shared as reference data by researchers with deep knowledge of life science, human body, cells, immunity, digestive organ or circulatory system. We often ignore it as not so important because we’re told by MDs that you have no problem or small concerns about the blood test result in many cases.

Especially most people, we have no attention about it if it’s far from some disease risk area. To manage the individual health control by the information of disease detection we need to use the correlation between health data and disease risk. It’s almost hard to increase our healthiness or QoL for better life by checking the single data.

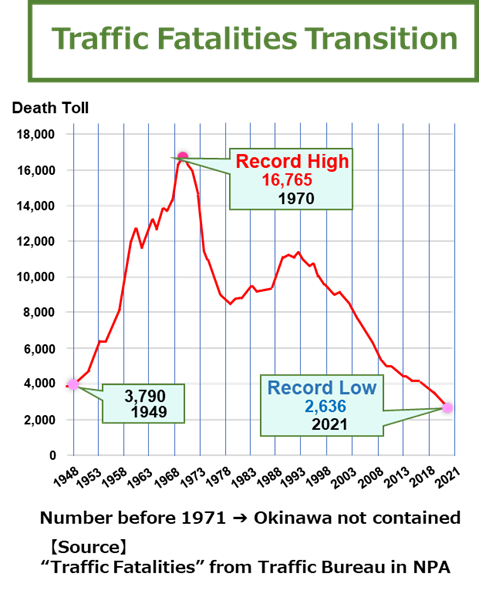
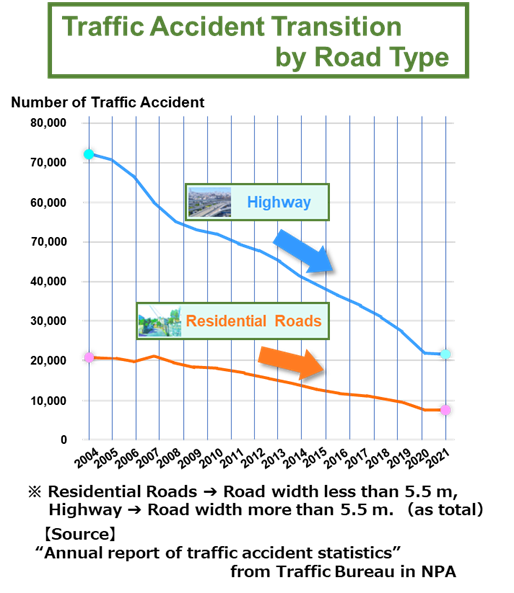
We actually need the convincing inferred data to a certain accuracy although we’re often pointed or heard about the GAP of average life span and healthy one in Japanese, how much long margin gained today, aging and dementia/MCI risk or ourselves disease risk that are anxious topics. In the past years the death by traffic accident attracted so much attention on the peak time as traffic war and it’s not high number today. However, the mortality of cancer exceeds greatly more than the death of traffic and suicide. We must identify the importance to be solved seriously and surely as an important theme.

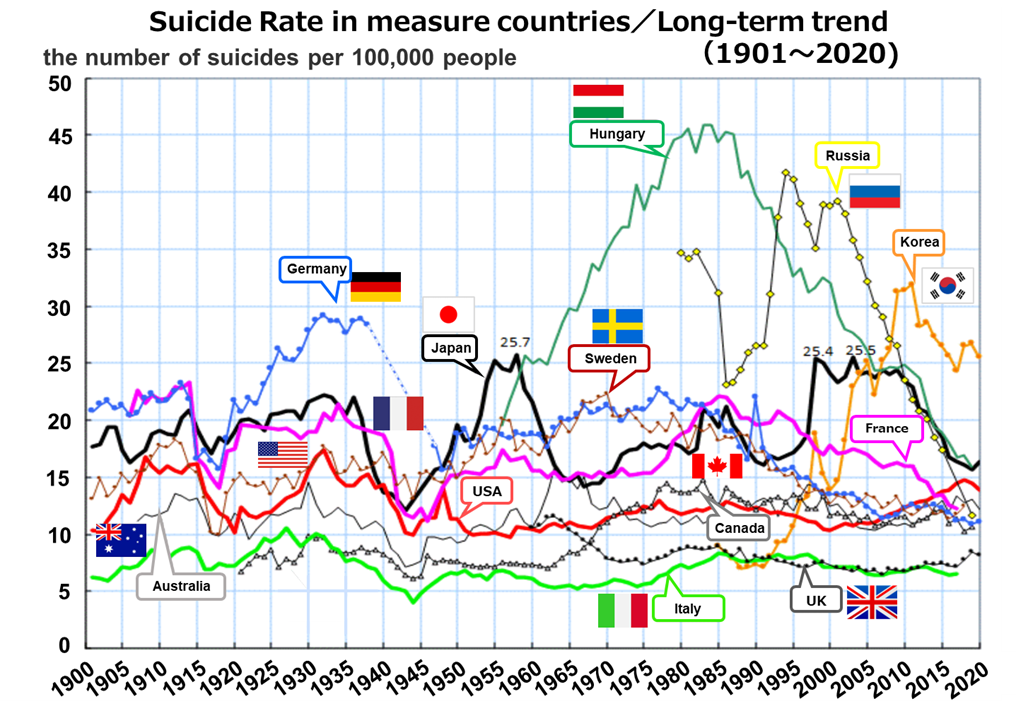
The suicide per 100,000 population in Japan was about 25 persons. The number has been relatively going down today but it is higher than France, Germany and Canada. It’s almost double compared to Italy or UK. The suicide number in Korea is over 25 persons and it’s the highest one in OECD.

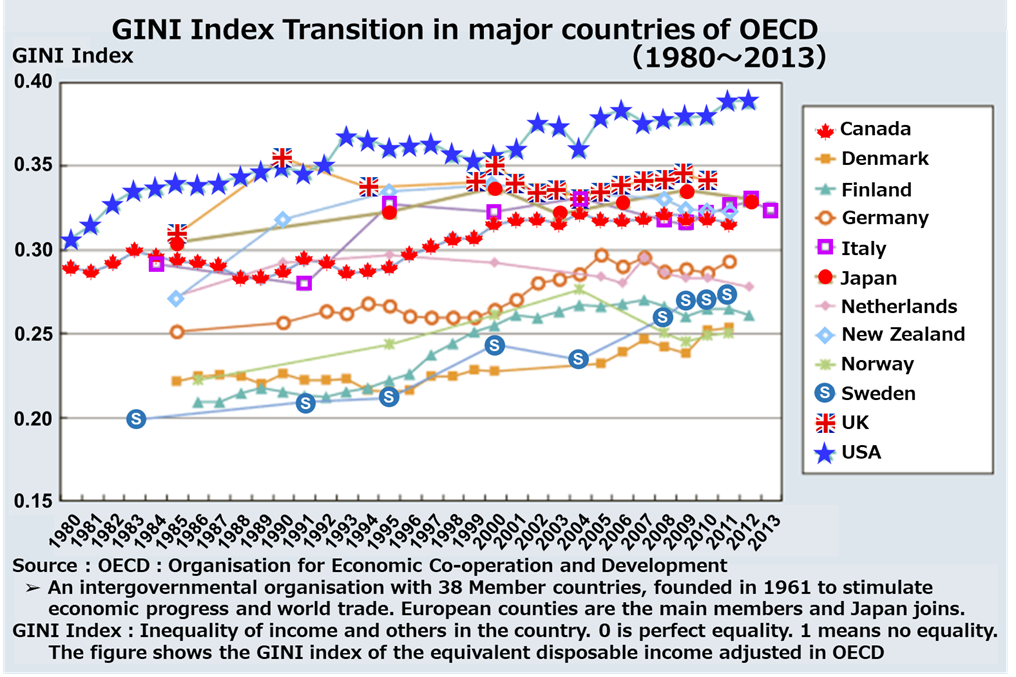
It is said that the suicide rate has high correlation with GINI coefficient or poverty rate. The poverty rate in Korea shows drastically high like 45.4% and the rate of Japan is lower than the OECD average. However, it’s slightly higher than the other OECD.

GINI index/coefficient is the number between 0 and 1.0 developed by Italian statistician Corrado Gini in 1912, measuring income/wealth distribution to show the perfect equality 0 and the perfect inequality 1.0 across a population in the country. The figure shows the GINI index adjusted by dividing the all of the annual disposable income by the household population in the world.

In Japan case, the GINI is tried to control to meet the good balance by TAX and others but it is pointed out that the economic stagnation could be happening if the GINI index is too low like almost zero because of no incentive or no motivation to work. The social unrest, outbreak of terrorism or coup might be occurring even in Japan if the number is too high. Some experts emphasize the importance of GINI index balance to realize the ideal society. Japan has aging issue or elderly society structure one but it’s well-known to struggle against the worst-case scenario like the quick shift into extreme inequality society until today.

モーダルクローズボタン

Disease risk
zero

AXR will realize the super healthy society With big smiles and endless happiness, Reducing the disease risk down to zero.

Generally speaking, the early-stage cancer identification like Stage Zero or I, can increase the 5-year survival rate to reach over 80%. However, the survival probability is going down if the cancer identification is delayed. Actually, the survival rate of pancreas cancer stage IV is 1.4%.

It’s very unhappy, hopeless and heartrending to have the life expectancy because of the cancer from M.D. It means that the patient has to accept the remaining time with his/her family and friends and it will end the life forcedly. In Japan the cancer statistical data shows that one second of male and one third of female can be cancer in their life and two third of cancer patients can survive if they’re lucky. One third can be killed and the number is going to be worse.

The spread of infection by Covid-19 has been influencing Japanese’ immunity and the death number in Japan has been increasing in the past two years. The record breaking can be happening in 2023.

AXR believes that “Health Promotion Service” can change the one-side defensive game and the innovation of “Healthcare Promotion Service” could be the chance. Until today so many people cannot accept it and I’m only possible exception. I’m OK. They could be exception. AXR makes people easily to live in healthy life or improved healthy one with QoL by the visualization technology of healthiness and disease risk, changing the direction from cure to care. AXR is proceeding it by mathematical science and AI, increasing the evidence since 2022.

モーダルクローズボタン

Analyze
Flow

Sample Model (I)

Answer Survey and Choose Courses (Free & Paid)

icon_3

Providing Health Checkup Data / Vital Data / Medical Interview Data

icon_3

Visualizing Health with Heat Maps / Transition Maps

icon_3

Return the Q&A of health habits and health impediments to users weekly or bi-weekly

icon_3

Provide the users “Dynamic Spider Chart” and “Healthcare Advice” fully-optimized for the individuals

icon_3

Next Step after the results confirmation of health data analysis

icon_3

In the case of Close Proximity of the Current HealthLevel to Specific Diseases

Encourage Behavior Change for QoL Consider the proposal of how to get the best health condition The Best Practical Advice for QoL Propose you various options to meet your requirements and concerns

© 2025 AXION RESEARCH INC. All Rights Reserved.